

What Really Changes?
Why your favorite team is better (or worse) in Clutch Situations

It’s no secret that some teams perform better in close games than others. This is often attributed to a variety of factors. Whether its execution, luck, or having the “it” factor as some people call it, everyone has their own explanation. Rather than debating the reason for a teams performance, it is important to look at why a team performed better or worse.
The main catalyst for an offense to stall out is bad shot selection. In basketball, there is no button you can press or switch you can flip to just start making more shots. Even the best three point shooters make less than half of their attempts. A team’s fate is sometimes determined simply by variation. Sometimes bad shots go in and sometimes good shots miss. However, what teams have some control of is the quality of shots that they are getting. While defenses do try to take away certain shots, the offense can still dictate the shot a possession yields. When looking at why a team went on a run or why they went on a cold stretch, their shot selection can often lend to that answer. This is very evident in college basketball. Whether for better or worse, some teams seem to adopt a different strategy down the stretch of close games.
In order to evaluate clutch shooting, we first need to define what a clutch situation is. While most people consider clutch situations the last few minutes of a game when the score is close, there is no unanimous exact definition. The NBA defines clutch situations as the last 5 minutes when the score differential is 5 points or less. I think that definition misses a lot of cases when the score differential is 6-8 points and the game is still in reach. For this analysis, clutch situations will be defines as follows.
Score differential ≤ 8, and 3-6 minutes remaining
Score differential ≤ 7, and 1-3 minutes remaining
Score differential ≤ 6, in final minute and overtime
While there is no perfect definition, this is wider than the NBA’s definition. It captures situations where the game is still within reach for the trailing team, but not those where a comeback is inconceivable. To measure clutch shooting, we will use Effective Field Goal Percentage (EFG%) which adjust for a three pointer being worth 50% more points than two pointers.
EFG% = (Field Goals Made + (0.5 * 3 Point Field Goals Made)) / (Field Goals Attempted)
Below are the 68 NCAA Tournament teams in the 2024-2025 season. Teams are ranked by their EFG% in clutch situations. Also included is their change in EFG% from Clutch to Non-Clutch situations and the number of shot attempts in clutch situations. The data include regular season and postseason games (against other Division 1 opponents). For comparison, the average team will be around 50% EFG in all situations.
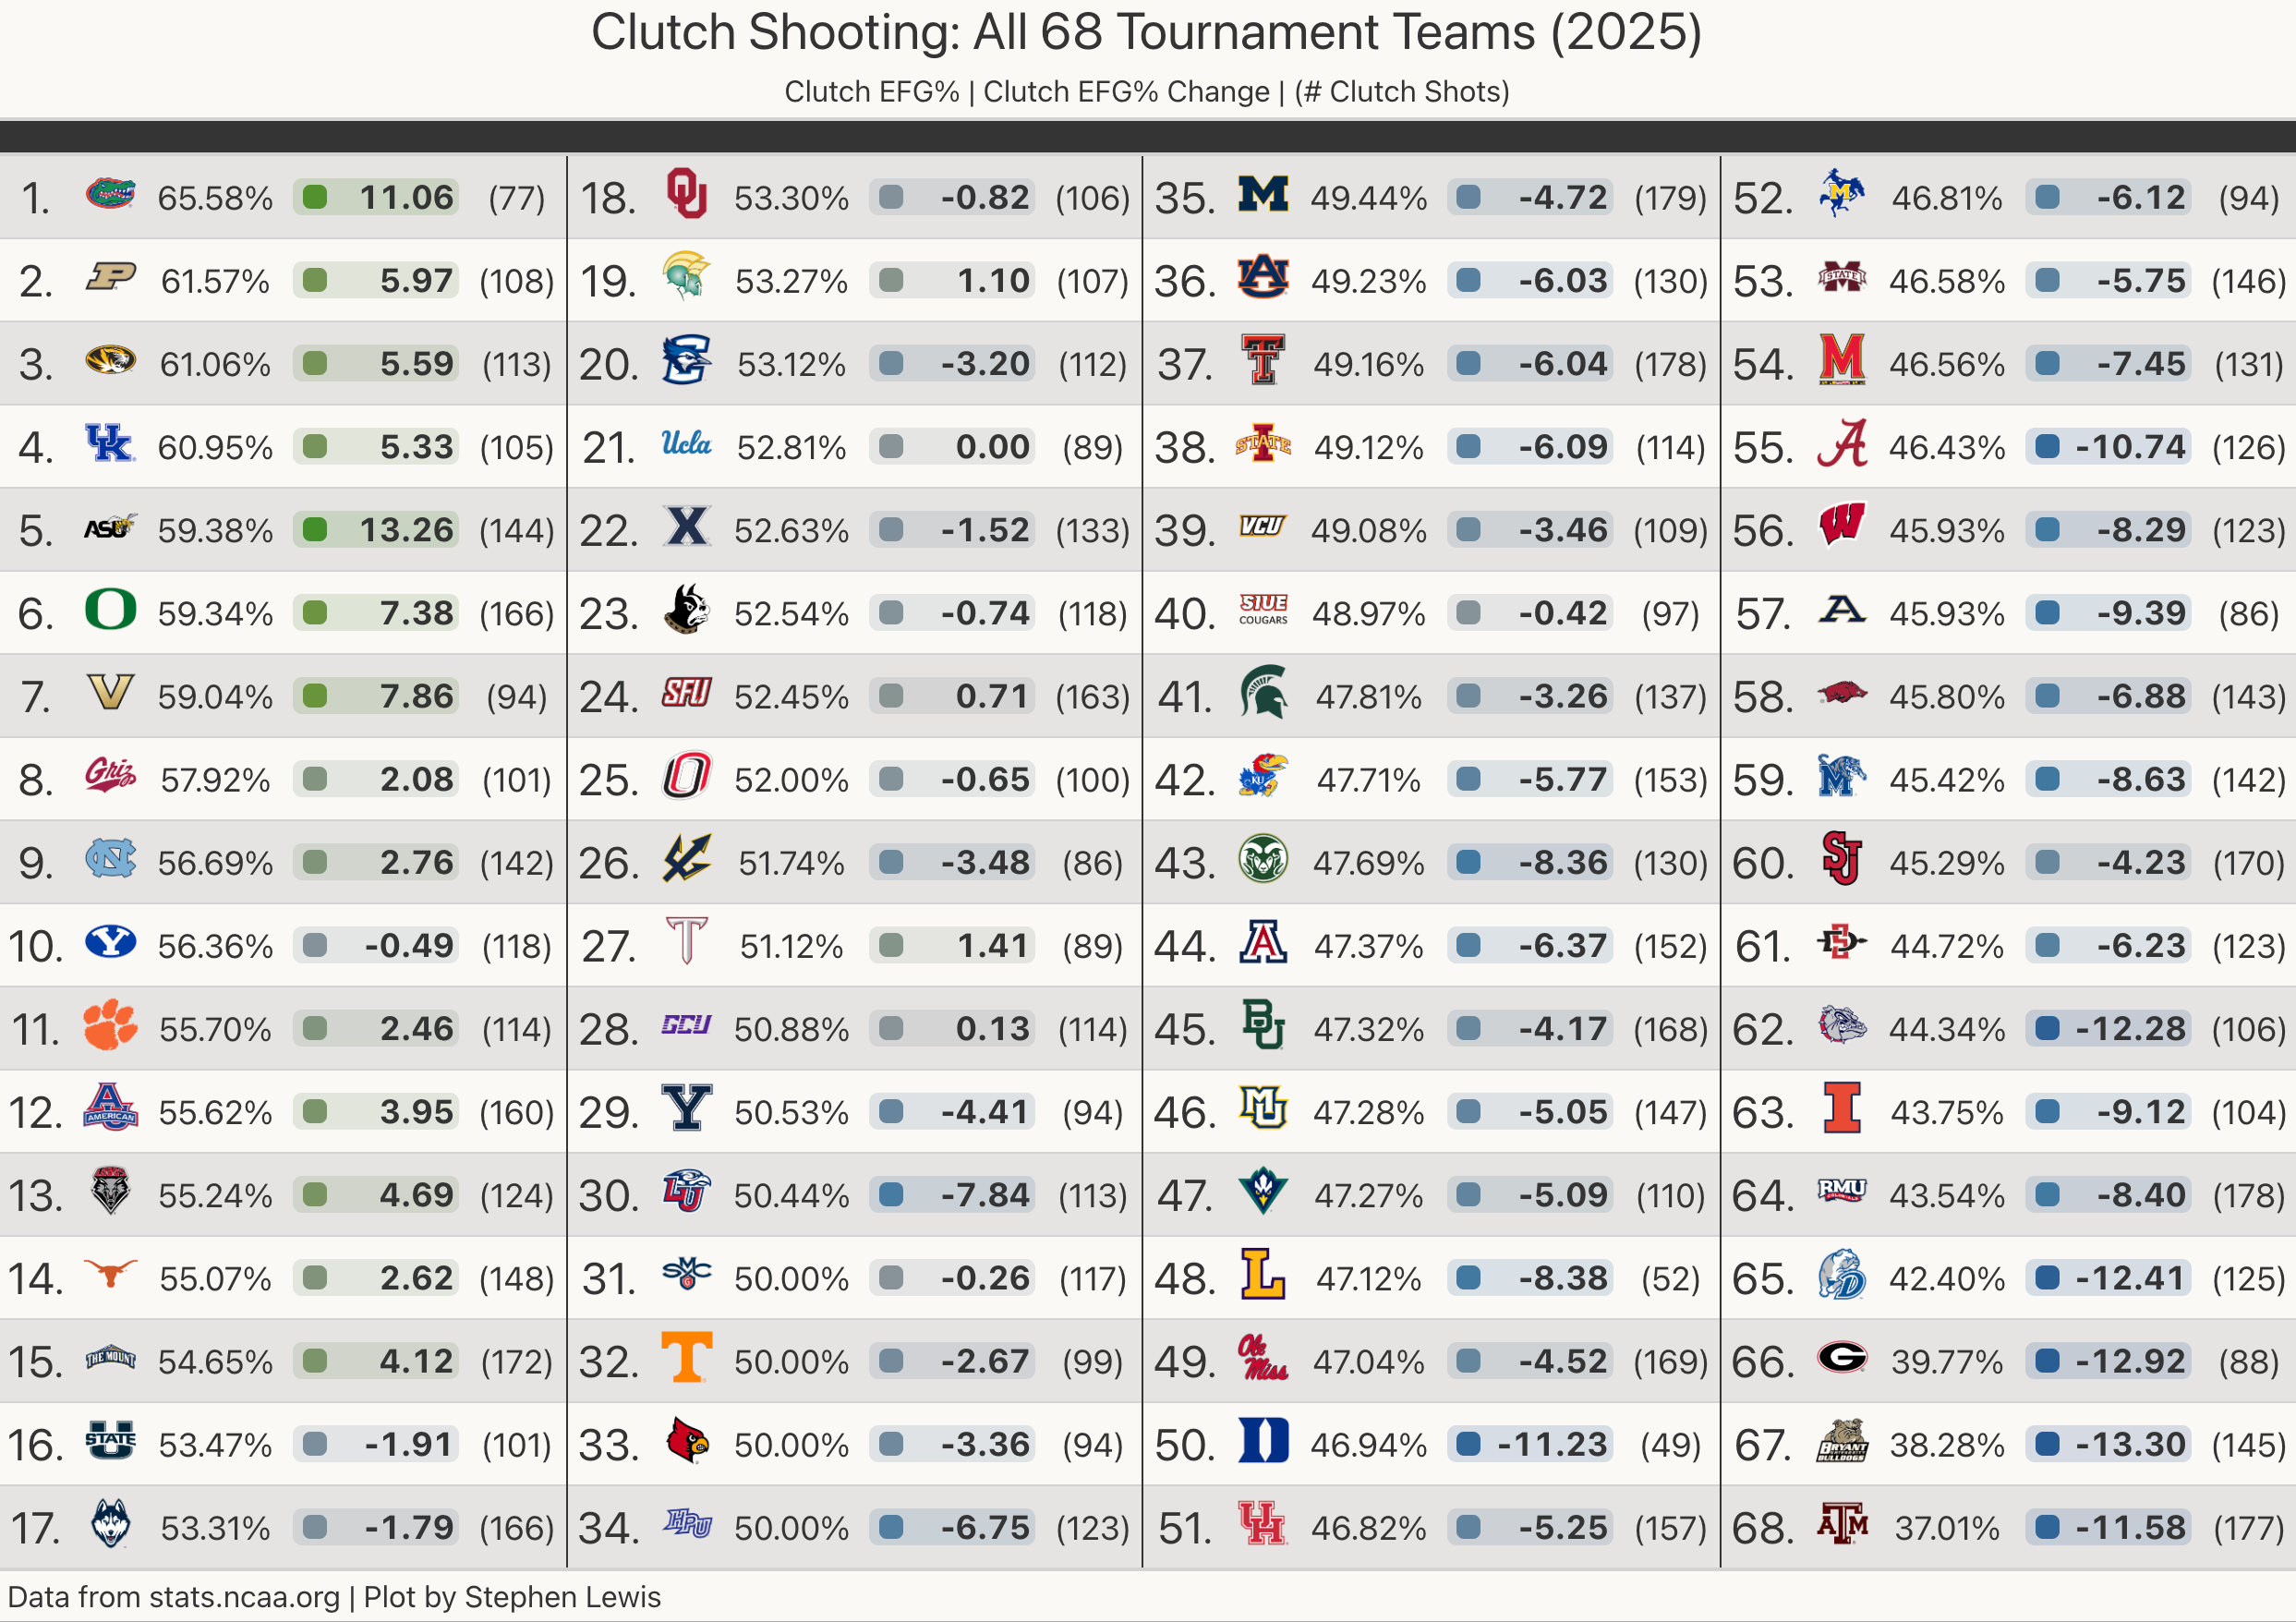
Another thing to keep in mind with these numbers is the number of shot attempts. Even for the most consistent shooting teams, percentages can vary a lot in a game and a season. While most teams have 100-150 clutch shot attempts, some teams have less than 50. For example, Duke was a top 5 team for most of the season and had an average margin of victory over 20 which resulted in them only having 49 clutch shot attempts. Although their 11% drop in EFG% is not good, they are only 2 or 3 shots away from being above average in that category.
The Worst Clutch Shooting teams
For the teams that did not perform well in clutch situations, their shot selection likely player a big part in that drop off. The chart below (Inspired by The F5, which you should check out after reading this) shows the bottom 9 tournament teams in clutch EFG%. The colored areas show where they shot more or less in clutch situations compared to where they shot in non-clutch situations1.
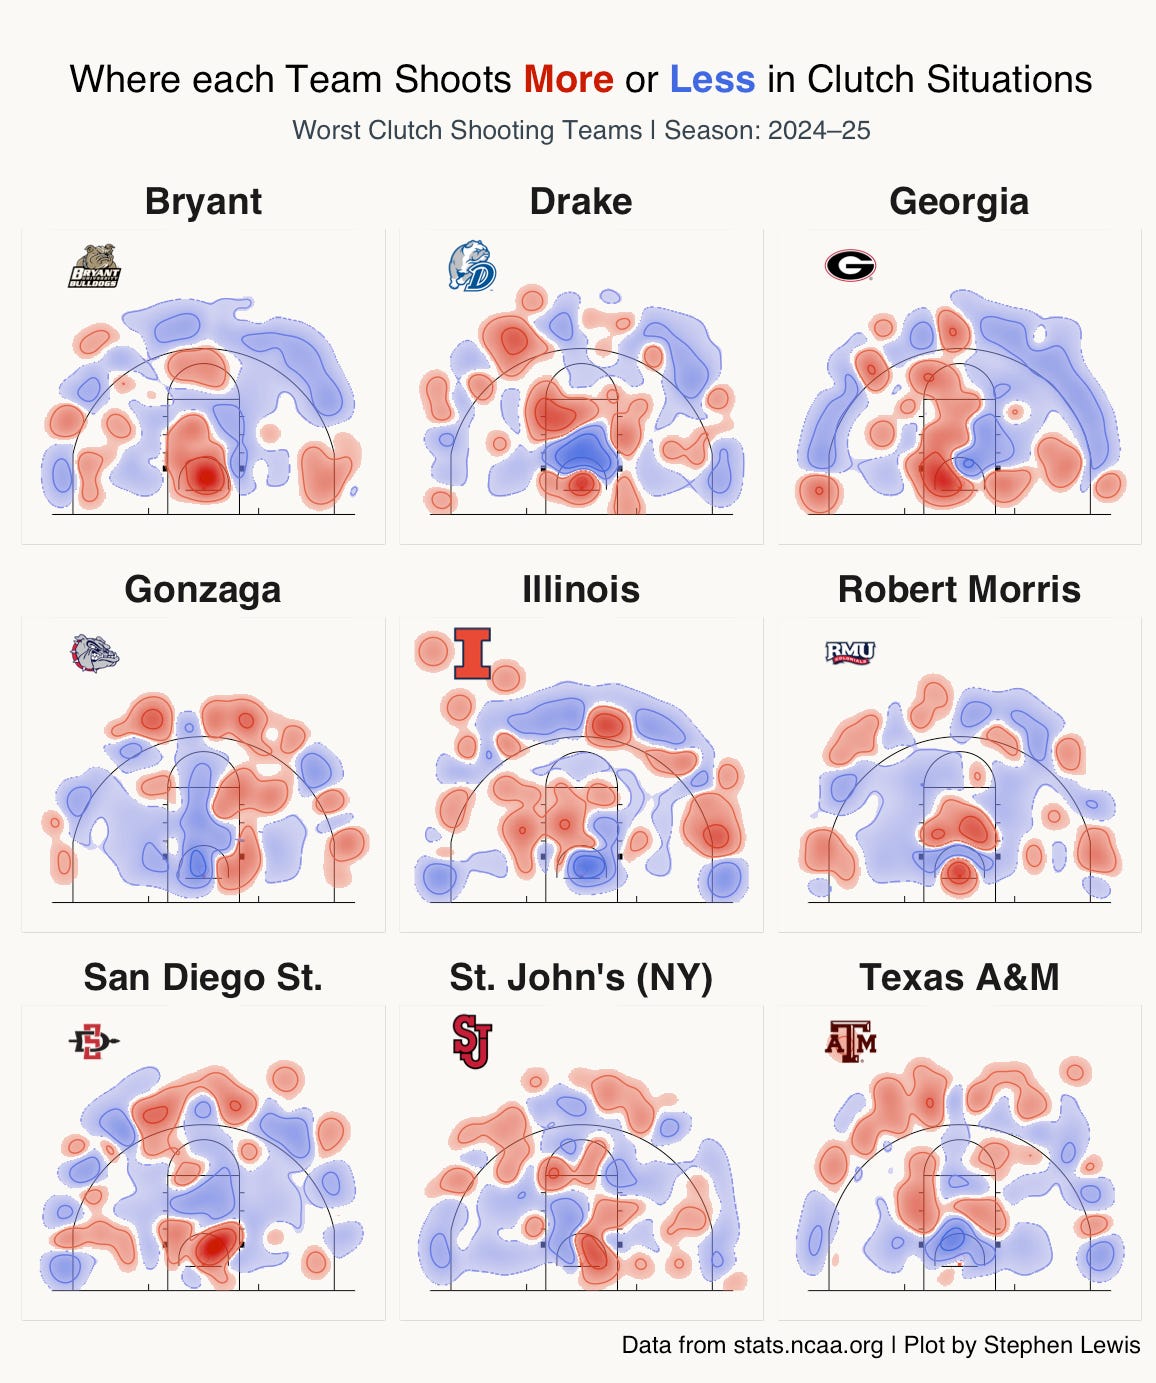
While some teams like San Diego State and Bryant took more shots at the rim, other teams like Texas A&M and Gonzaga took less at the rim. Interestingly, some teams like St. Johns took more shots on ons side of the basket than the other.
The Best Clutch Shooting teams
The other side of the coin is the teams that improved their clutch shooting. Below are the top 9 tournament teams in clutch EFG%. Alabama State was the biggest riser shooting over 13% better. They increased their attempts at the rim. A team like Vanderbilt decreased their rim attempts but still shot almost 8% better.
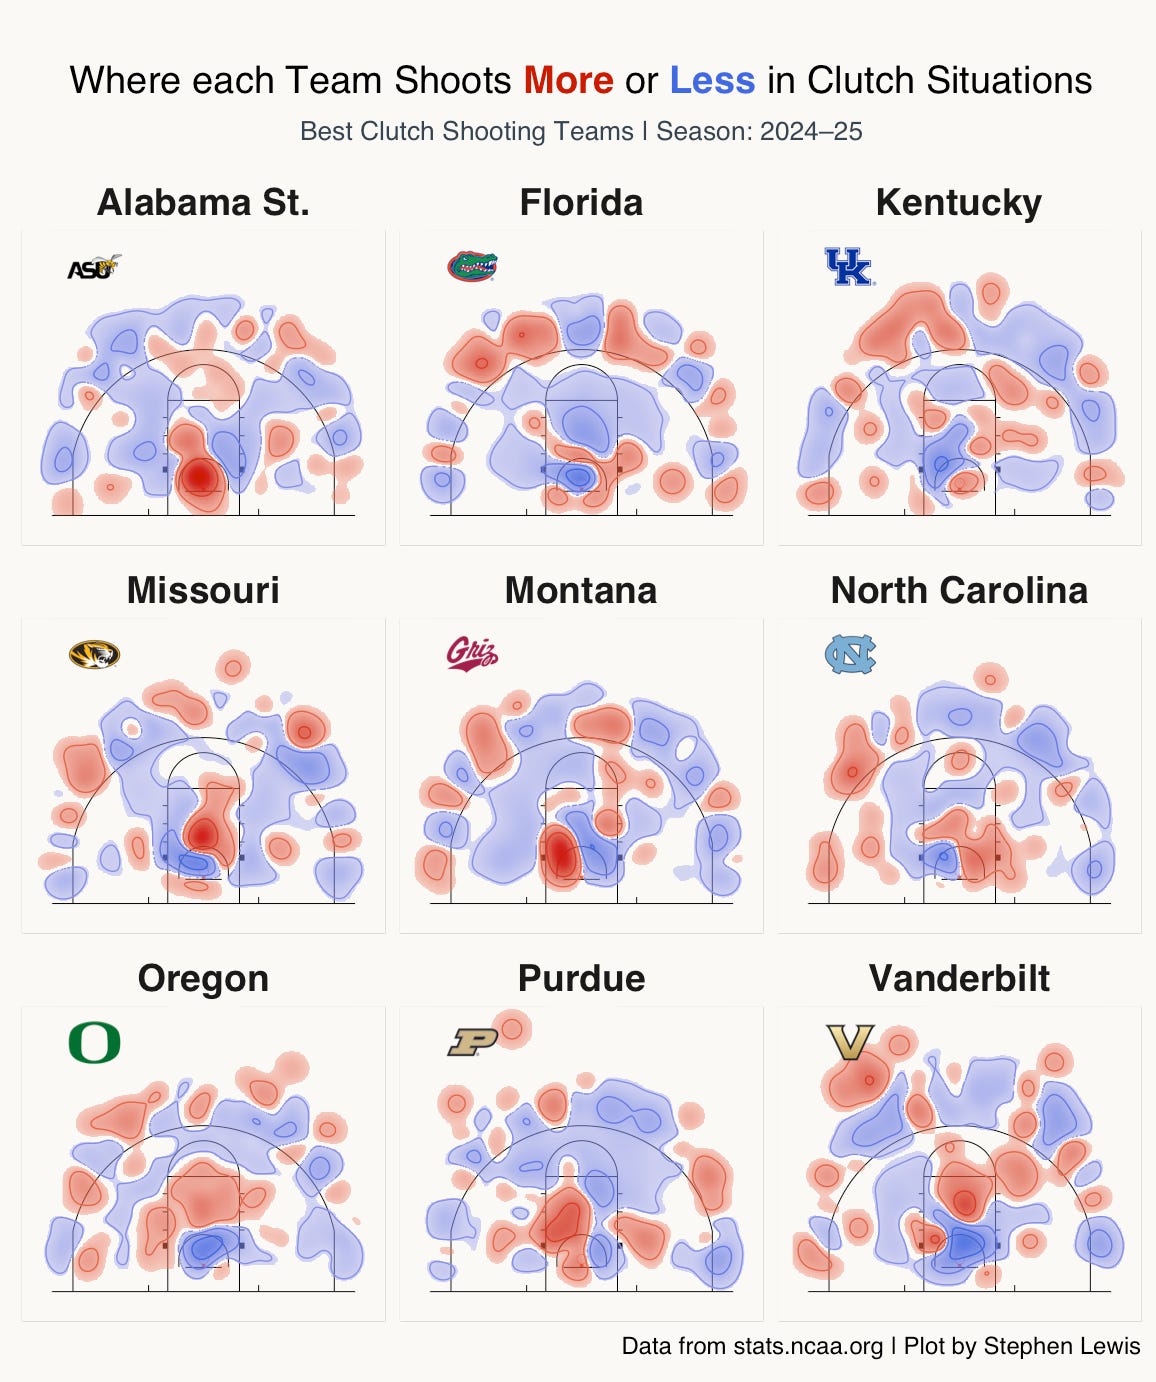
Finally, there is Florida who won the National Championship. With an EFG% over 65% (and an 11% increase), they posted one of the more unique shot charts with defined hot shots around the three point line and near the rim. It’s not hard for anybody that watched the tournament to see why their shot chart looks like this:
Walter Clayton Jr. took 18 of Florida’s 49 clutch shots during the season (before the NCAA Tournament). During the Tournament, that number increased to 16 of Florida’s 28 clutch shots. Every year, there seems to be a player who elevates their game (and their draft stock). In Florida’s Tournament run, Clayton shot an implausible …
90.6 EFG%
That is more than a hot streak, that’s plot armor.
In case you’re curious, here are the other 50 tournament teams clutch heat maps. If you enjoyed this post, subscribe for free to receive new posts and support my work.
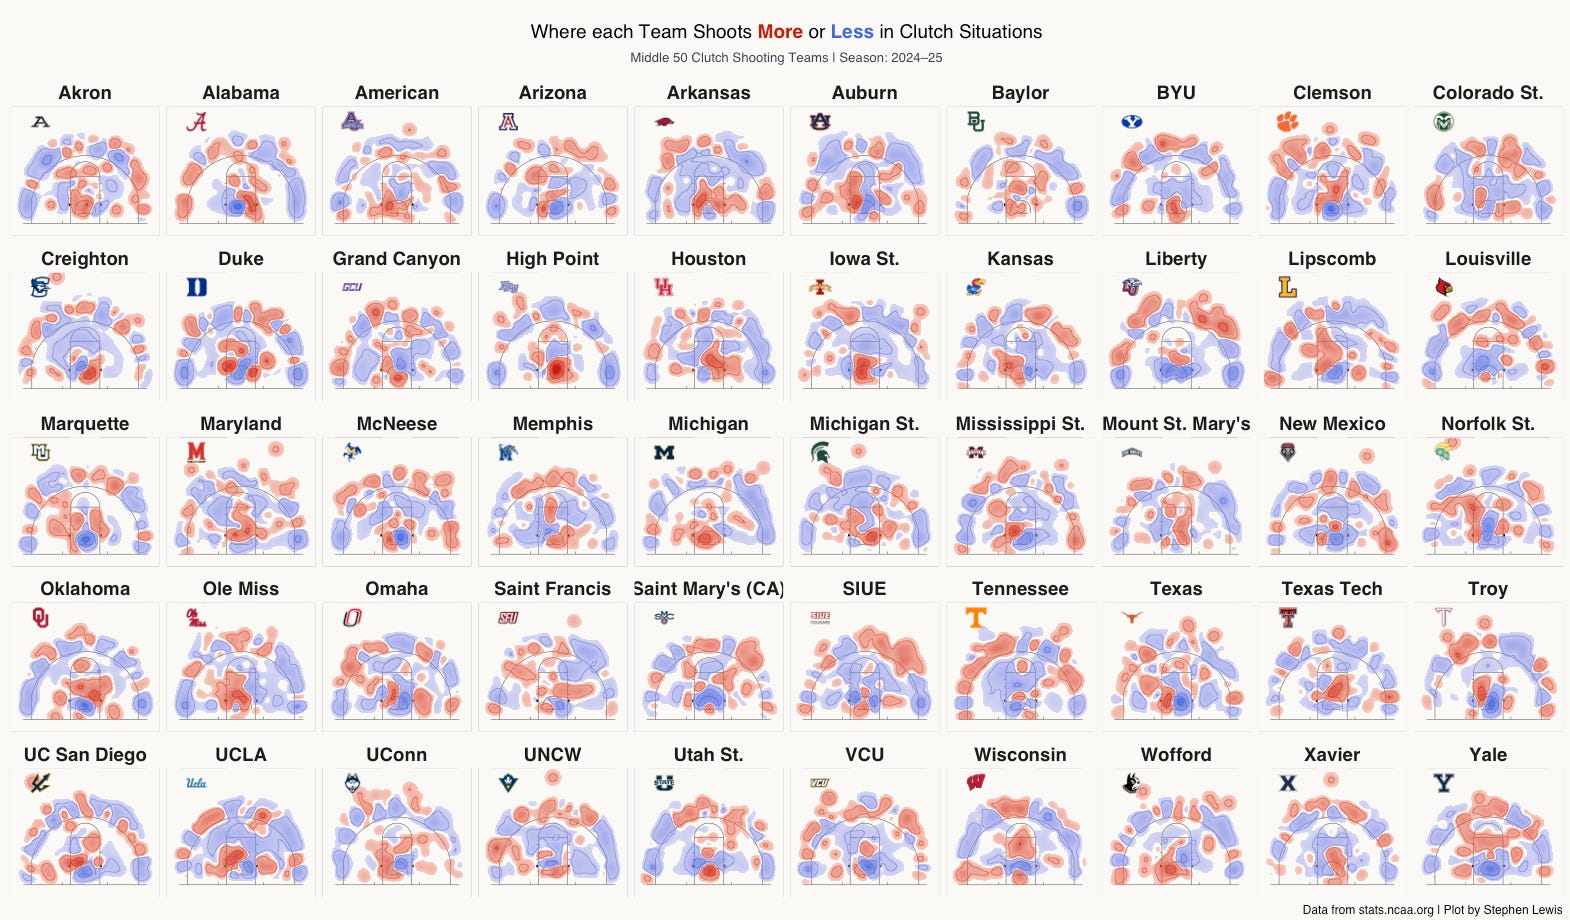
Due to the low number of shot attempts for some teams, certain areas may only represent a small number of shot attempts.